Reliability, Availability, and Maintainability are the language reliability engineers use to keep physical assets running. Applied with care, the same discipline offers a useful—and more humane—way to think about workforce resilience.
Reliability, Availability, and Maintainability are the language reliability engineers use to keep physical assets running. The same discipline — applied with care — is one of the most underused tools in workforce strategy.
In any heavy industry, we obsess over the reliability of our equipment. We calculate mean time between failures for a compressor, model the availability of a process train, and design maintenance strategies down to the bearing. We would never run a refinery on the hope that the rotating equipment "feels motivated this quarter."
Yet when it comes to the most complex, most consequential, and most variable asset in the entire operation — the people running it — most organizations fall back on intuition, annual surveys, and reactive firefighting.
A useful lens has been hiding in plain sight inside the reliability engineering toolkit. The framework is RAM: Reliability, Availability, and Maintainability. This article makes the case for treating human capital as a system worthy of the same rigor we apply to physical assets — and, just as importantly, explains where that analogy ends and why its limits are actually the most useful part.
The reliability heritage: humans fail the way equipment fails
The formal bridge between human performance and reliability engineering already exists. It is called Human Reliability Assessment (HRA), and its founding premise is blunt: a human operator commits errors in the same way equipment can fail, which means analysts can assign error probabilities based on a detailed task analysis [1].
The best-known method is the Technique for Human Error Rate Prediction (THERP), developed in the nuclear industry and now used across high-hazard sectors. THERP is a structured five-stage process [2]:
- Define the system failures of interest.
- List and analyze the related human operations, identifying potential errors and the recovery modes that could catch them.
- Estimate the human error probabilities using simulators, accident reports, and expert judgment.
- Evaluate the effect of each human error on the system's failure events.
- Recommend changes to the system and recalculate the failure probabilities.
What makes this powerful is that it produces numbers. And the numbers tell a story every operations leader should internalize.
The data: reliability collapses under stress
A trained operator working in good conditions, without undue stress, has an error probability somewhere between 10⁻² and 10⁻⁴ — somewhere between one mistake in a hundred and one in ten thousand. Put that same human under genuine stress — a crisis, a novel situation, severe time pressure — and the error probability does not drift upward. It collapses, jumping to 0.5 to 1.0 [3]. In the worst case, error becomes a near certainty.
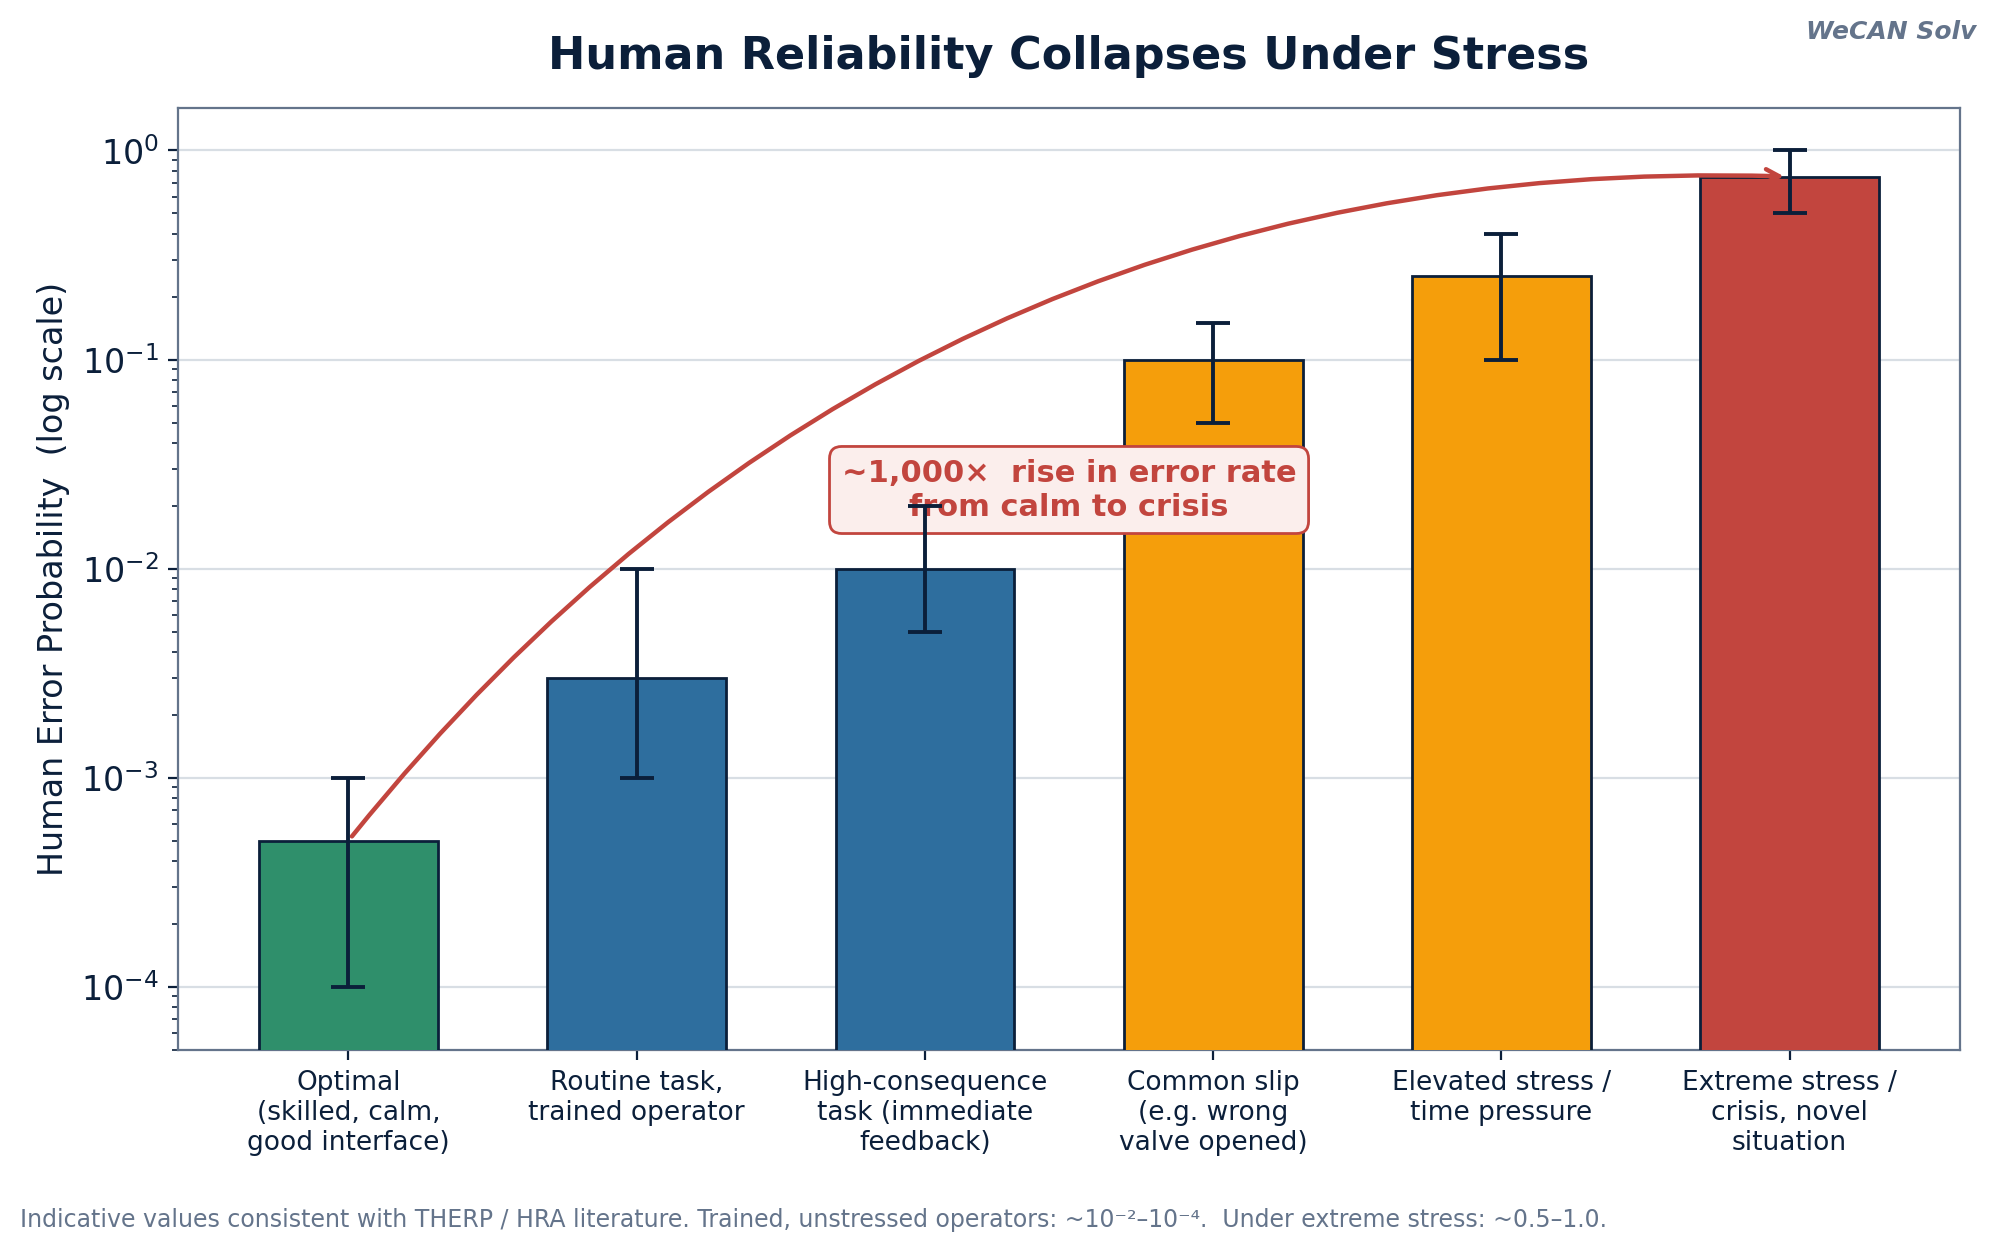
In field practice, this gets translated into working assumptions. In oil and gas, a common screening value assigns roughly a 0.1 probability to a routine slip — an operator opening the wrong valve — and a stricter 0.01 probability to tasks that carry immediate, high consequences and therefore receive more attention and verification [4].
The practical lesson is not "people are unreliable." It is that human reliability is a function of conditions, and conditions are designable. Which brings us to the levers.
Performance Shaping Factors: the levers you actually control
HRA calls the conditions that drive error rates up or down Performance Shaping Factors (PSFs). They are the human-capital equivalent of operating context for a machine — and they are where a leader's real influence lives.
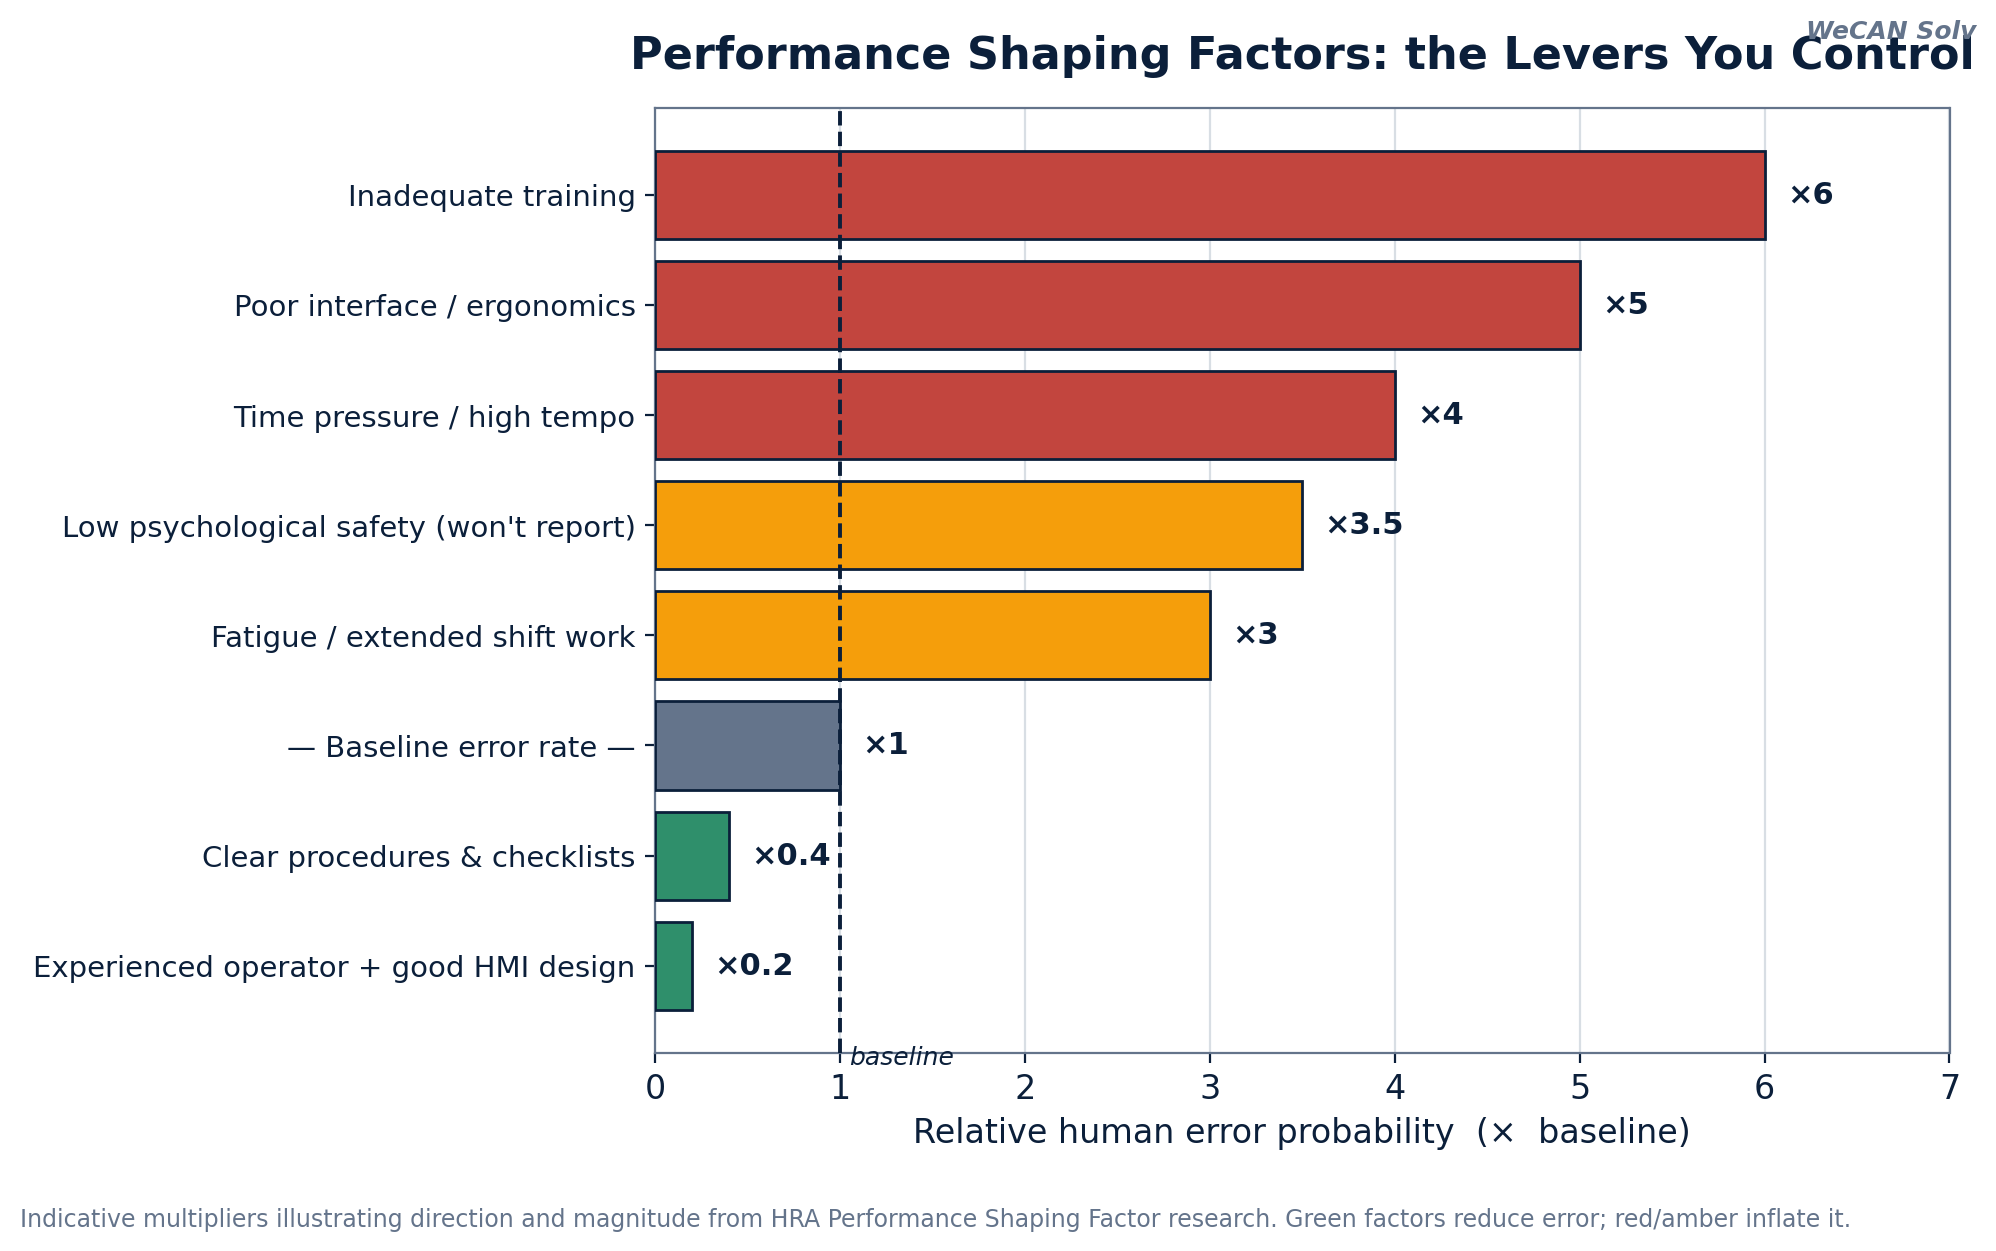
Inadequate training, time pressure, fatigue from extended shift work, a poorly designed interface, and a culture where people won't admit a mistake all multiply the error rate. Experienced people, clear procedures, and well-designed work pull it back down. None of these factors is a mystery. All of them sit inside management's control. The reliability question is simply: which way are your PSFs pointing?
Reliability is only one-third of the picture
Here is where most discussions of human reliability stop — and where they go wrong. Reliability is necessary but radically insufficient. A workforce is a system, and a system has three properties, not one. The full RAM framework forces us to ask all three questions.
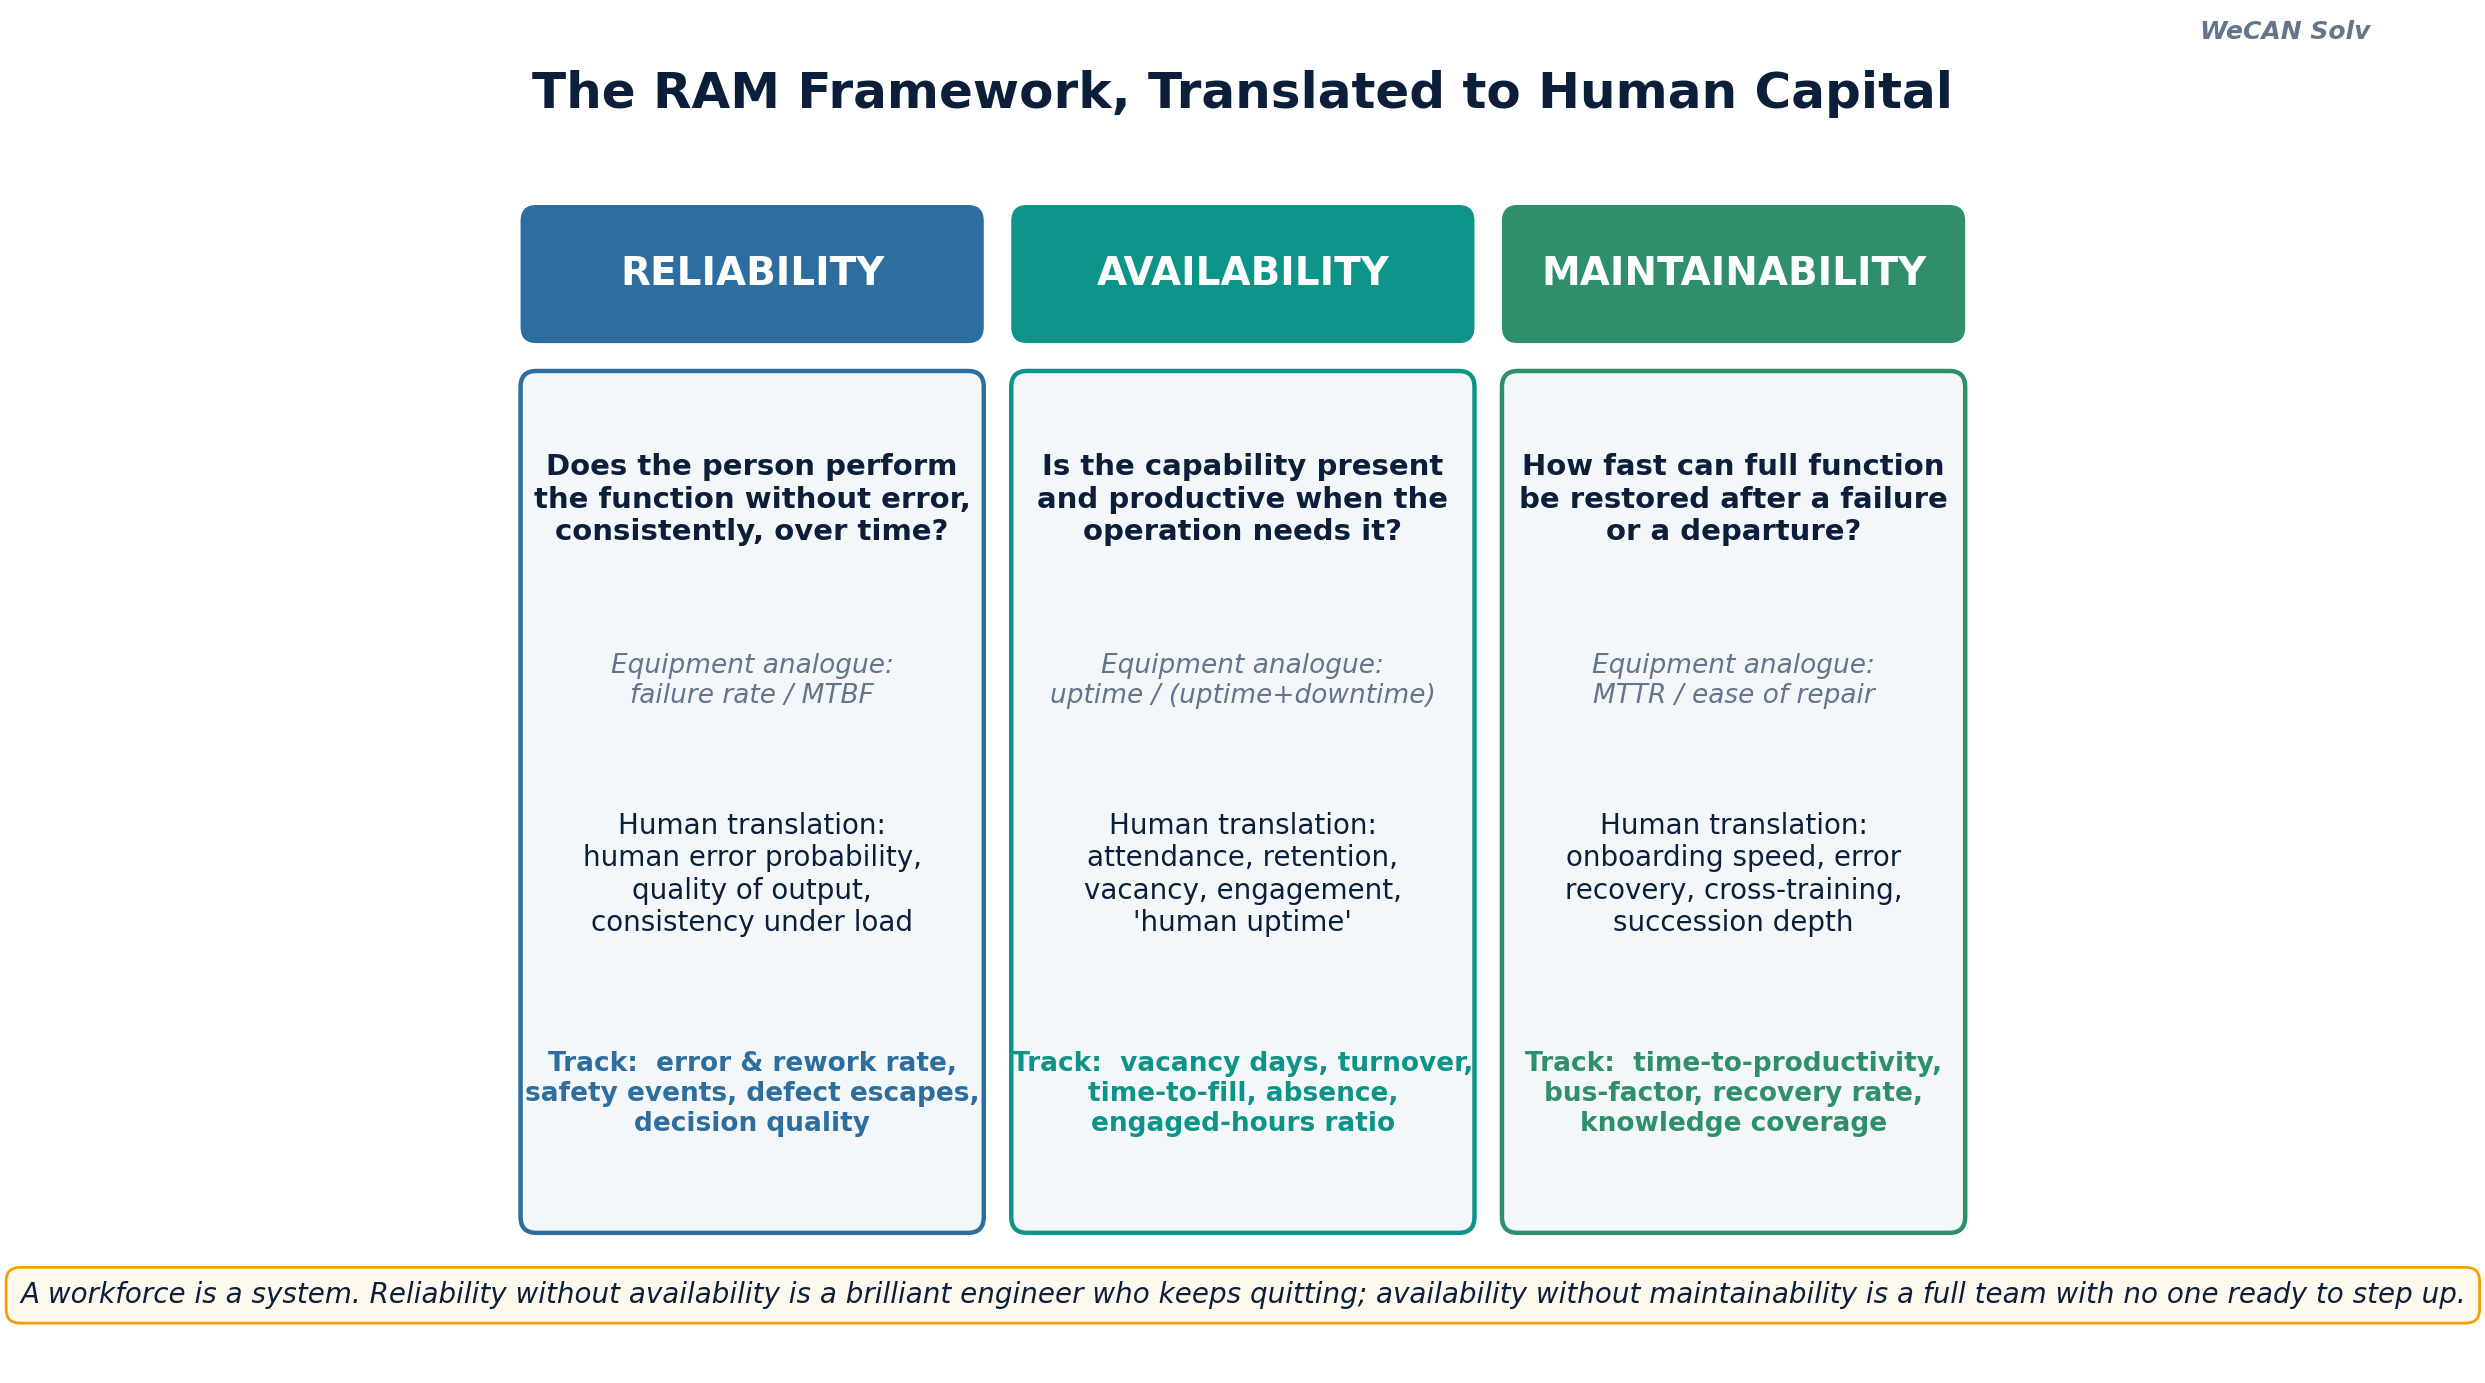
Reliability without availability is a brilliant engineer who keeps quitting. Availability without maintainability is a fully staffed team in which no one is ready to step up when a key person leaves. You need all three.
Availability: the human uptime problem
In asset management, availability is the proportion of time a system is ready to perform when called upon. The defining equation is:
Availability = MTBF / (MTBF + MTTR) (mean time between failures, over the sum of that and mean time to repair)
Translate this directly. For a person or a role:
- MTBF becomes the mean time between disruptive "failures" — a resignation, a burnout episode, an extended leave, a disengagement spiral.
- MTTR becomes the time to restore the capability — to fill the vacancy, onboard the replacement, and ramp them to full productivity.
Seen this way, your best engineer resigning is an unplanned outage. The role is down. And like any critical asset waiting on a long-lead spare part, the recovery time is brutal: weeks to fill, months to ramp, often a year before the replacement matches the departed expert's output. During that entire window, availability is degraded.
The trouble is that human availability leaks through dozens of small, often-invisible losses, not just the dramatic resignation. Borrowing the logic of Overall Equipment Effectiveness — the OEE metric every reliability engineer knows — we can decompose where human capacity actually goes.
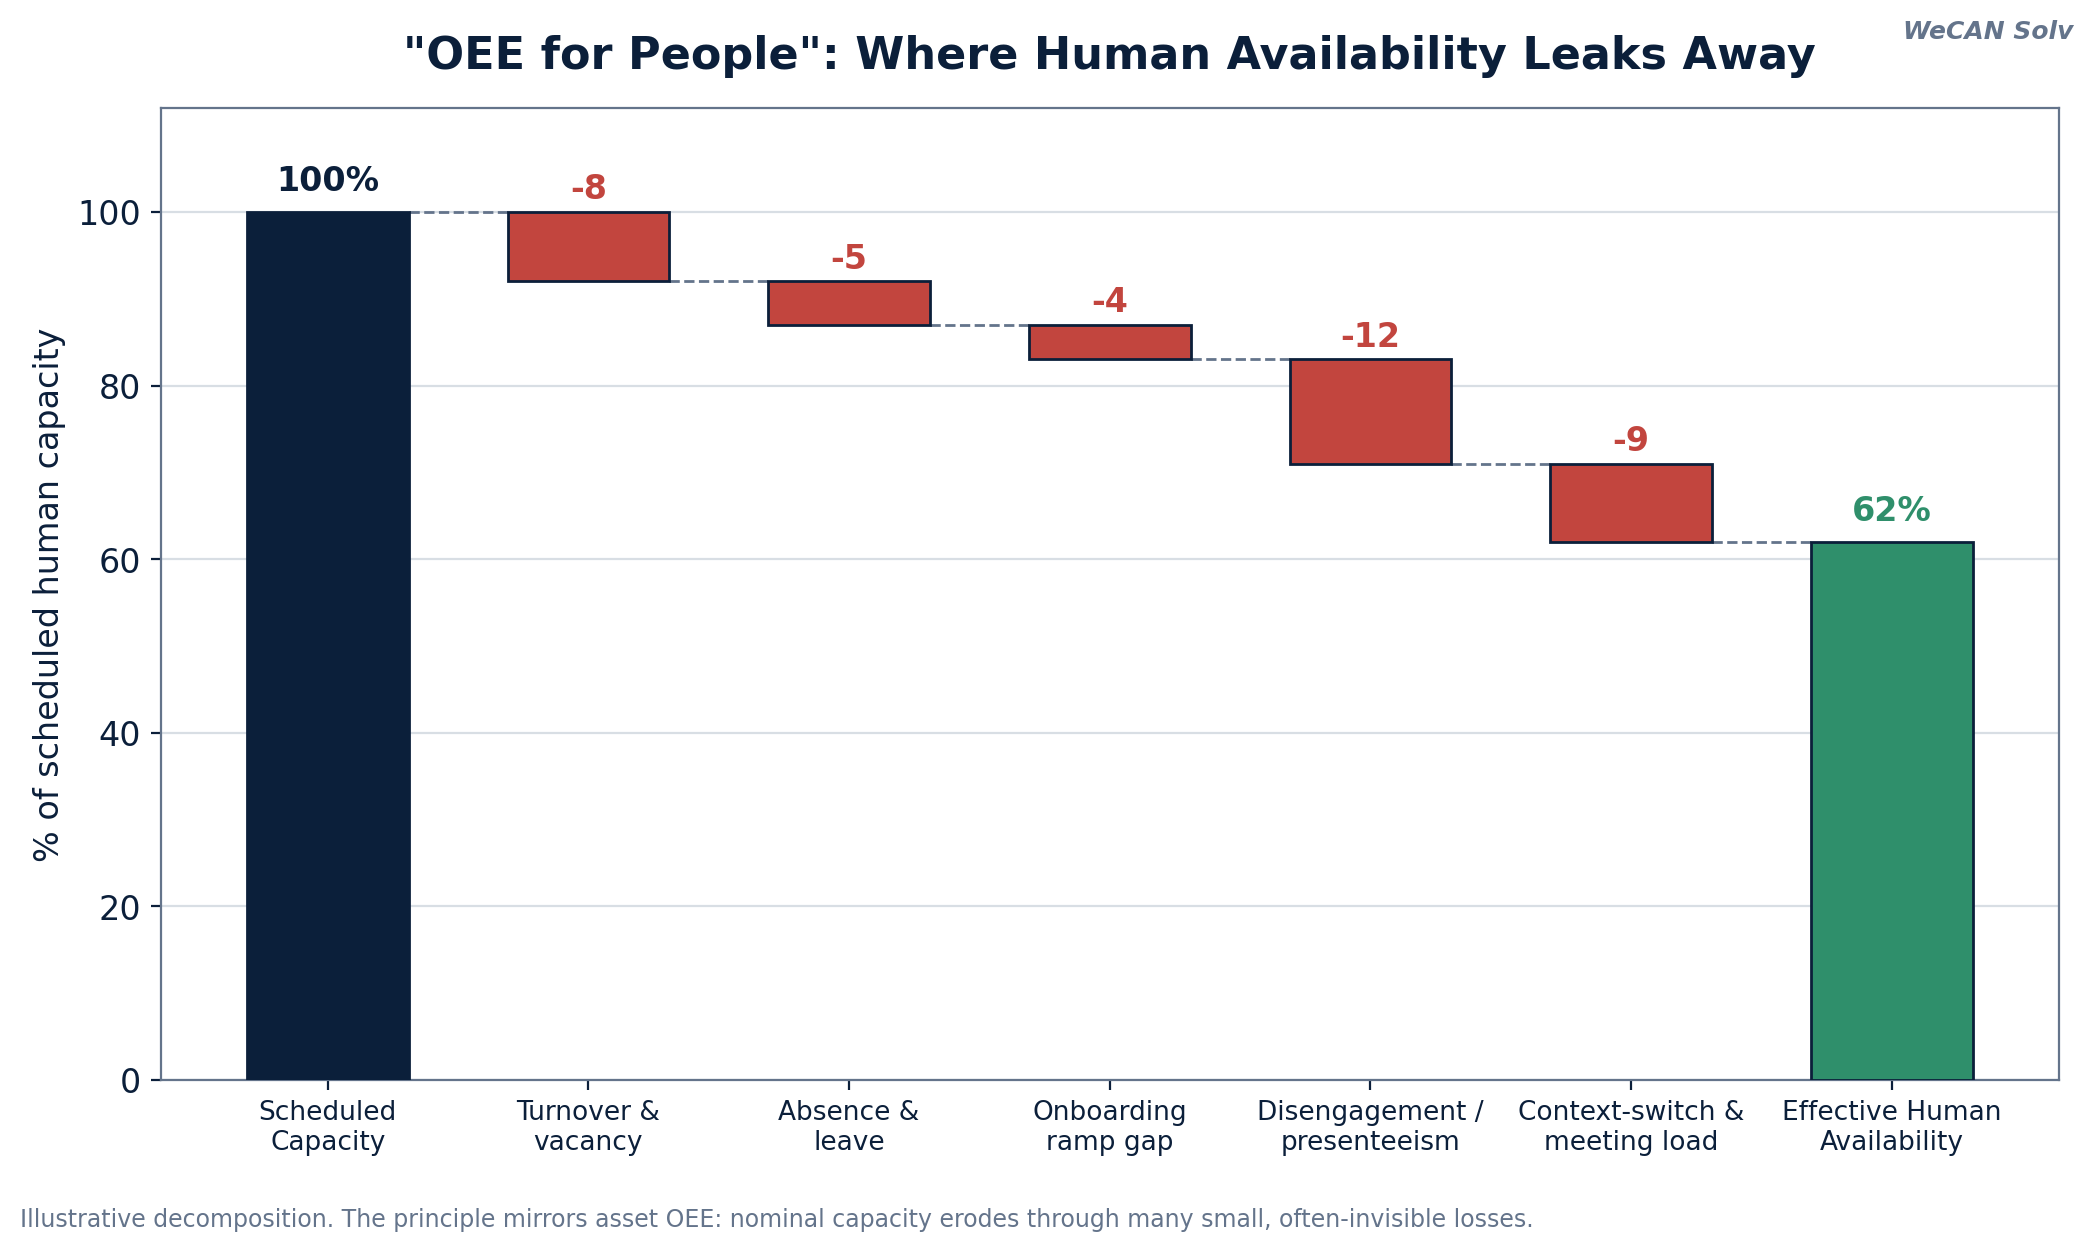
Scheduled capacity erodes through turnover and vacancy, absence and leave, the productivity gap during onboarding, the silent drain of disengagement and presenteeism (present in body, absent in contribution), and the modern epidemic of context-switching and meeting overload. The specific numbers vary by organization, but the structure is universal: the nominal headcount on your org chart is not the effective capacity you actually have. Measuring the gap is the first act of managing it.
Maintainability: how fast you restore function
Maintainability — the M that almost everyone forgets — is the speed and ease with which a system is restored to full function after a failure. For human capital, it has four faces, and reliability engineering has something to say about each.
Error recovery. THERP explicitly models recovery factors — the chances that a human error is caught and corrected before it propagates into system failure. The most maintainable human systems are not the ones that never err; they are the ones designed so errors are visible and reversible. Independent verification on critical valve line-ups, two-person rules, read-backs, and well-placed checkpoints are all recovery factors. They convert a latent failure into a near-miss.
Redundancy and the bus factor. Reliability engineers design out single points of failure with N+1 redundancy. The human equivalent is the uncomfortable "bus factor": how many people would have to be hit by a bus before a critical capability is lost? When deep knowledge lives in one undocumented head, you are running a critical asset with no spare and no drawings. Cross-training, documentation, and deliberate knowledge transfer are the redundancy that makes a team maintainable.
Restoration speed. Just as MTTR is a design property of equipment, time-to-productivity is a design property of an organization. Structured onboarding, ready-to-go knowledge bases, defined apprenticeship paths, and bench strength in succession planning are the difference between a six-week recovery and a six-month one.
Just culture. None of the above works if people hide their mistakes. The safety science pioneer James Reason drew the essential distinction between a person approach — which blames the individual and drives error underground — and a system approach, which treats most errors as the predictable product of latent organizational conditions. A "just culture" that distinguishes honest error from recklessness keeps the error-reporting channel open, which is the single most important input to both reliability improvement and fast recovery.
The economics: there is an optimum
For leaders working where reliability and economics are inseparable, the most important chart is the last one because it reframes "investing in people" from a soft cost into an optimization problem with a defensible answer.
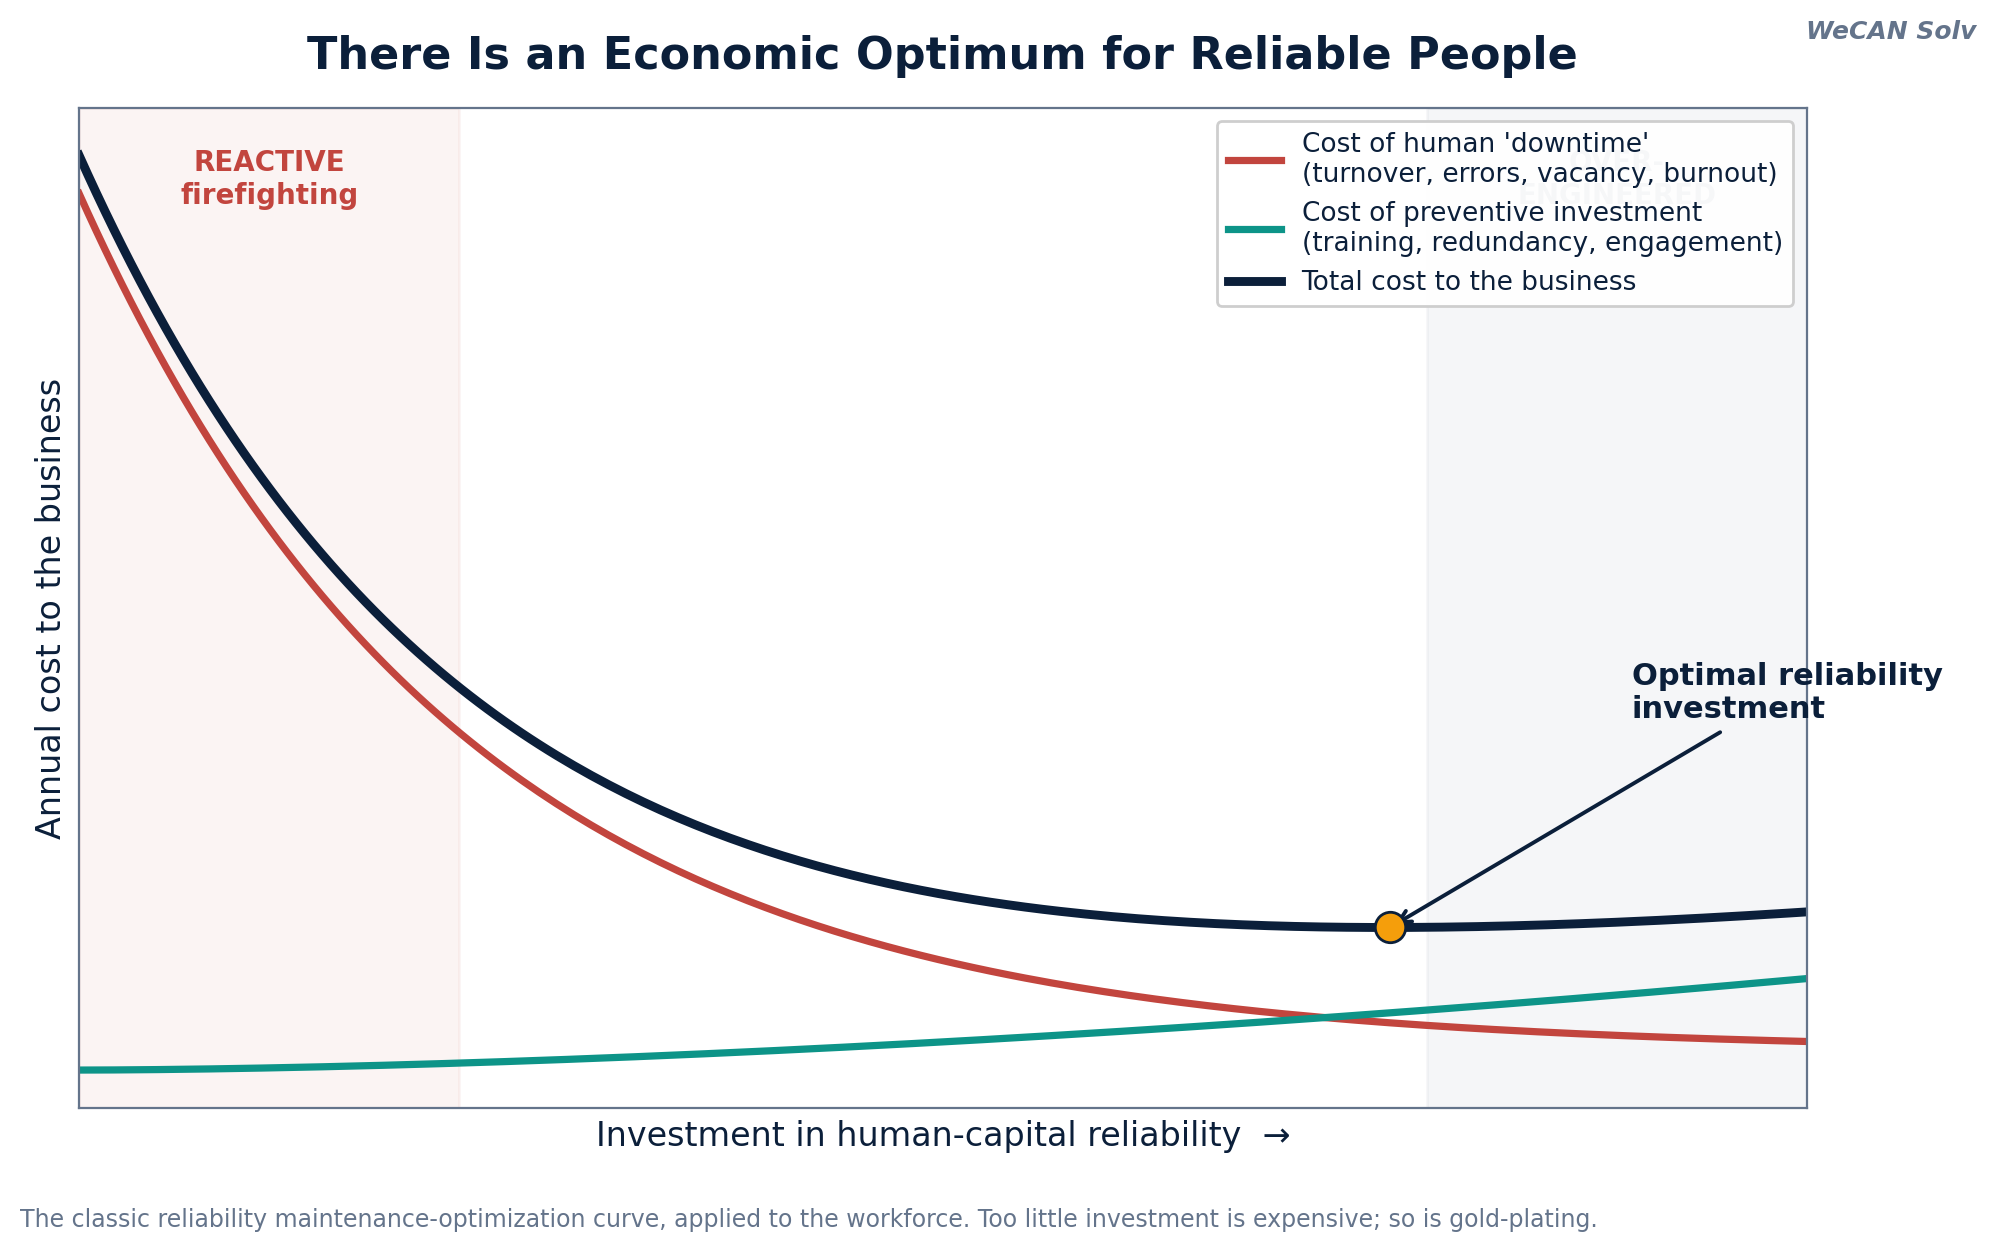
This is the classic reliability maintenance-optimization curve, applied to the workforce. On one axis, investment in human-capital reliability — training, redundancy, engagement, workload management. As that investment rises, the cost of human "downtime" — turnover backfill, error and rework, vacancy, burnout, lost institutional knowledge — falls steeply. But the cost of the investment itself rises. The total cost to the business is the sum of the two, and it forms a U.
The reactive end of the curve — minimal investment, constant firefighting — is expensive, and most organizations live there without realizing it because the costs are diffuse and unbudgeted. The far end — gold-plating every role — is wasteful too. There is an economic optimum, and finding it for your critical roles is exactly the kind of analysis reliability engineering already knows how to do. The only novelty is pointing it at people.
How to apply it: a starting playbook
You do not need to quantify your entire workforce to benefit. Start with the critical few roles whose failure would most threaten safety, production, or value — the same way you would prioritize asset criticality. Then run the THERP logic, adapted for human capital:
- Define the human-capital failures that matter most. Not "low engagement" in the abstract, but specific, consequential events: the sudden loss of your only subsea integrity specialist; a quality escape from a fatigued night shift; a botched turnaround handover.
- Map the human operations and recovery modes around each. Who does what, under what conditions, and what would catch an error or absorb a departure before it becomes a system failure?
- Estimate the probabilities and exposures — turnover risk, error likelihood under realistic PSFs, time-to-restore. Hard data will be imperfect; informed estimates beat silent assumptions.
- Evaluate the system effect. What does each failure actually cost in safety, downtime, and value? This is what turns an HR concern into a business case.
- Recommend changes and re-estimate. Improve the PSFs, build redundancy, shorten recovery — then recalculate. This is continuous improvement, not a one-time audit.
Track it on a simple HR-RAM scorecard that mirrors how you already report asset health:
| Pillar | What it asks | Representative metrics |
|---|---|---|
| Reliability | Performs the function without error, consistently | Error & rework rate, safety events, defect escapes, decision quality |
| Availability | Present and productive when the operation needs it | Vacancy days, turnover rate, time-to-fill, absence, engaged-hours ratio |
| Maintainability | Function restored quickly after a failure or departure | Time-to-productivity, bus-factor coverage, error-recovery rate, succession depth |
Where the analogy ends — and why that matters most
A responsible article on this topic has to draw the line clearly, because the line is the whole point.
People are not components. The HRA discipline says so itself. Reviews of these methods consistently flag the lack of sufficient "hard data" from real human experience and experiments, which produces troubling variability between the conclusions of different analysts [5]. Two competent people can model the same task and reach materially different error probabilities. That is precisely why standard practice insists on a multi-disciplinary approach — engineers, human-factors specialists, operations, and the people doing the work, together — whenever human reliability is assessed [5]. The numbers are a structured conversation, not a verdict.
But here is the resolution, and it is the most important idea in this piece. The factors that make humans more reliable are, almost without exception, the things that make work more humane. Look again at the Performance Shaping Factors. What lowers error rates? Adequate rest instead of fatigue. Reasonable workload instead of crushing time pressure. Good training. Well-designed tools and interfaces. A culture where people feel safe enough to say "I made a mistake." There is no version of this framework where you make people more reliable by grinding them harder. The mechanistic, person-blaming approach to human error doesn't just feel wrong — it measurably increases error rates, depresses availability through burnout and turnover, and destroys the reporting culture that maintainability depends on.
So the RAM lens, applied honestly, does not lead to treating people like machines. It leads to the opposite. It gives a hard-nosed, economically rigorous, reliability-engineering argument for exactly the conditions that good leaders have always wanted to create — and it lets you measure your way there.
The workforce is the most complex and most leverage-rich asset in any operation. It is long past time we brought the same discipline to it that we bring to the rotating equipment — and discovered, in the process, that reliability and humanity were pointing the same direction all along.
Sources and notes
The following source notes and scope caveat are preserved from the supplied article package.
- [1] Foundations of Human Reliability Assessment (HRA). Human error treated analogously to equipment failure.
- [2] THERP five-stage methodology. A structured approach to defining human-failure events, analyzing tasks and recovery modes, estimating probabilities, evaluating system effect, and re-estimating after changes.
- [3] Human error probability ranges. Indicative ranges by operating condition and stress level.
- [4] Oil and gas field screening assumptions. Illustrative screening values for routine slips and high-consequence tasks.
- [5] Reviews of HRA methods. Limits include incomplete hard data, analyst variability, and the need for a multidisciplinary assessment approach.
Visual note. The error-probability and Performance Shaping Factor visuals present indicative values consistent with the HRA / THERP literature described above. The availability waterfall and investment curve are illustrative decompositions of the underlying principles. They are not industry benchmarks.